alter session set events 'immediate trace name flush_cache';
alter system flush buffer_cache;
2017年12月19日 星期二

LOG FILE SYNC概述
http://www.itpub.net/thread-1807437-1-1.html
来新公司工作,很大的一段时间都在调优日志写,提升系统的TPS,在这方面也积累了一些理论知识和实践经验,之前零零散散在微博上也发了很多关于log file sync的帖子,篇幅都很短,有些是自己优化系统过程中的一个心得,有些是看书过程中的一点感悟,这次把他们汇集起来,变得也更有可读性一些,作为自己的一个总结,也希望里面的内容也或多或少能够帮助到你。
log file sycn是ORACLE里最普遍的等待事件之一,一般log file sycn的等待时间都非常短 1-5ms,不会有什么问题,但是一旦出问题,往往都比较难解决。什么时候会产生log file sync等待?
常见有以下几种:
1)commit操作
2)rollback操作
3)DDL操作(DDL操作实施前都会首先进行一次commit)
4)DDL操作导致的数据字典修改所产生的commit
5)某些能递归修改数据字典的操作:比如查询SEQ的next值,可能会导致修改数据字典。一个典型的情况是,SEQ的cache属性设置为nocache,那么会导致每次调用SEQ都要修改数据字典,产生递归的commit。
一个正常的系统里,绝大多数的log file sycn等待都应该是上面描述的1)commit操作 造成的log file sycn等待,某些异常的系统,比如频频rollback、seq的cache设置为nocache的系统,也可能会造成比较多的log file sycn等待。
我们要是能知道log file sync包含哪些环节,再有针对性的优化各个环节,就能事半功倍了。
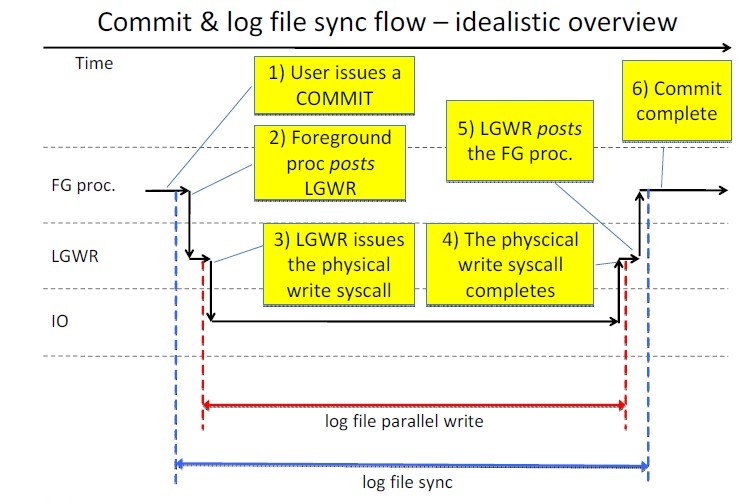
上面是Tanel Ponder画的log file sync等待事件的延迟图,在某些关键环节上打了点。我对其中打点的环节,稍作翻译如下:
1)用户进程发起commit
2)用户进程通知lgwr写日志
3)lgwr接收到请求开始写
4)lgwr写完成
5)lgwr通知用户进程写完成
6)用户进程获得通知,继续做其他事
1,2阶段的时间,主要是post/wait的时间,典型的这种post/wait一般利用的是操作系统的信号量(IPC)实现,如果系统CPU资源充足,一般不会出现大的延迟。前台进程post lgwr后,就开始等待log file sync。
2,3阶段的时间,主要是lgwr为了获取cpu资源,等待cpu调度的时间,如果系统cpu资源充足,一般不会出现大的延迟。这里我们需要知道,lgwr只是操作系统的一个进程,它需要操作系统的调度获取cpu资源后才可以工作
3,4阶段的时间,主要是真正的物理io时间,lgwr通知os把log buffer的内容写入到磁盘,然后lgwr进入睡眠(等待log file parallel write),这个时间正常情况下的延迟占整个log file sync的大部分时间。还需要指出,lgwr在获取cpu资源后,可能并不能马上通知os写磁盘,只有在确保所有的redo copy latch都已经被释放,才能开始真正的IO操作。
4,5阶段的时间,os调度lgwr 重新获得cpu资源,lgwr post前台进程写完成。lgwr可能会post很多前台进程(group commit的副作用)
5,6阶段的时间,前台进程接受到lgwr的通知,返回cpu运行队列,处理其他事物(log file sync结束)。
/*************************************************什么是group commit************************************************/
不止一次的看到过一些对log file sync调优的建议里写着:打开ORACLE的组提交功能。
group commit默认就是开启的,而且你没有任何手段可以关闭它!
我一直认为group commit这个东东起的名字不是太过恰当,应该起组刷新更恰当,仅仅代表个人意见。
什么是组提交?

上图是log buffer的抽象图,log buffer此时是非常繁忙的。
给大家设定这样一个场景。
c1作为一个commit record已经被copy到了log buffer里,接着前台进程通知lgwr去写日志,根据我前面的描述,在前台进程post lgwr去写,到lgwr真正开始写之前,非常可能存在着时间差,就在这个时间差里,c2,g1,c3也已经把相应的日志拷贝到了log buffer里,其中c1,c2,c3是commit的记录,g1仅仅是普通的事务日志,不是commit日志。在lgwr真正开始写之前,它会去检查当前log buffer的最高点,发现在c3位置处,把这个点作为此次刷新日志的目标,把c1,c2,g1,c3的日志都刷新到磁盘。虽然刷新日志这个操作是由c1出发的,但是c2,g1,c3也是受惠者搭了便车,日志也被刷新到了日志文件里,这个功能叫组提交,对于一些不太熟悉ORACLE的人容易把组提交误解为,把提交的事物打包刷新到日志里,其实LGWR是不管你的事务日志有没提交的,它只按照log buffer分配的最高点来刷新,因此我觉得叫组刷新更好点。
图中c1,c2,g1的日志已经拷贝完成,我用filled表示,c3的日志空间已经分配,但是还没完成拷贝,我用allo表示,这个情况下,其实lgwr需要等待c3日志拷贝完成,才能真正的开始刷新操作。
/*************************************************什么是group commit************************************************/
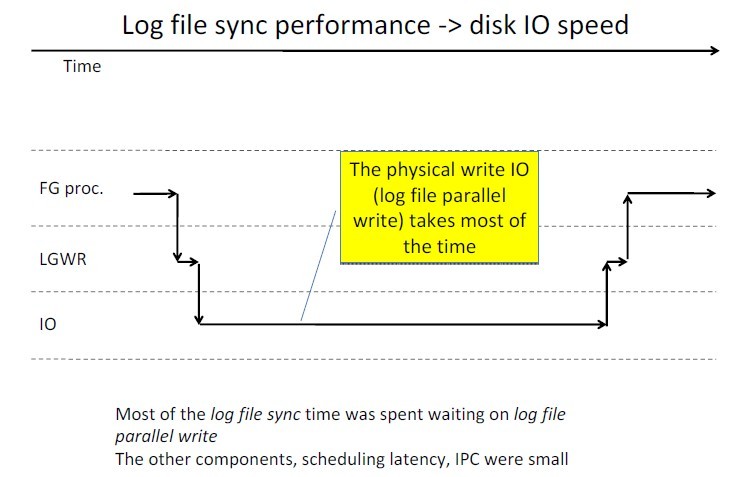
我们剖析了log file sycn的各个阶段后,可以看出,正常情况下,最慢的环节应该在3,4阶段(如上图),典型的io操作,这个环节对应的数据库等待叫做log file parallel write。其他的阶段如调度延迟、IPC时间一般都是极短的。网上、论坛上、包括不少书籍里,很多在log file sync出现问题后,往往都把责任推卸到IO慢的原因上。绝大多数情况下,这样的推断可能都是正确的,但是,事情不总是这样的,就像我们分析的,log file sync的快慢也是很依赖cpu资源是否富足、系统的负载是不是过大。我们再看下一幅图,这副图描述了,在CPU资源不足的情况下,各个阶段占取整个log file sycn的比重。
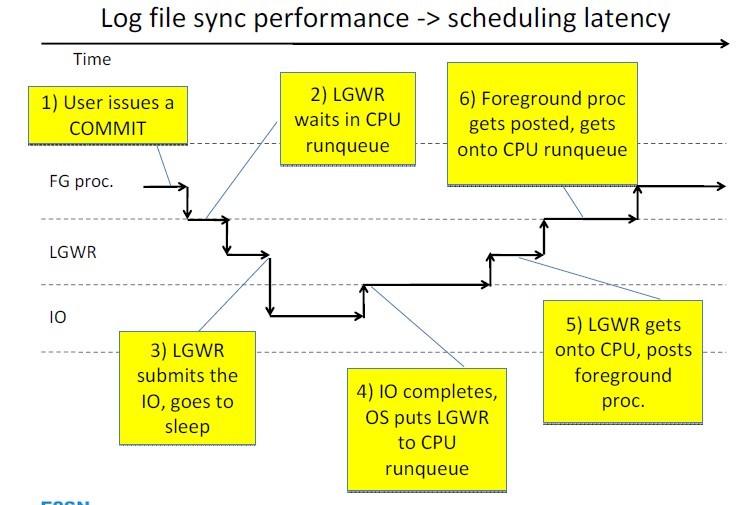
如你所见,由于CPU资源的不足、系统负载过大,导致操作系统调度出现了较大的延迟,3,4阶段的IO部分的延迟已经不是整个log file sync时间的最大的罪魁祸首!
/*********************************************小插曲*****************************************************************************/
lgwr会post哪些前台进程?
当lgwr刷新完日志后,会post相应的前台进程(wakeup)继续工作,那么lgwr怎么判断应该wakeup哪些前台进程呢?
log file sync等待的p1参数的含义为:P1 = buffer# in log buffer that needs to be flushed
当lgwr刷新完buffer后,会扫描活跃会话列表,查看哪些会话在等待log file sync,而且会话的buffer#小于等于它所刷新的log buffer的最大值,这些会话会被wakeup。
/*********************************************小插曲****************************************************************************/
LOG FILE SYNC调优
作为通用的log file sync的诊断、调优方法,一般可以通过诊断系统的IO延迟为多大,cpu资源是否充足来判断哪里出现了问题。
IO延迟的诊断、调优:可以通过log file parallel write这个后台进程等待事件来辅助判断。如果这个等待时间过大,那么你系统的IO很可能出现了问题。优化IO的手段一般为:RAID的方式不要为RAID5,最好为RAID10,关闭RAID卡的读CACHE,全部用作写CACHE,可以用2-4块盘作为日志的磁盘组,如果使用的是存储,一般存储机头的CACHE也比较大,IO上基本能得到保障。使用ssd作为日志组来提升IO并没有什么好的效果。可以通过 v$event_histogram视图获取log file sycn、log file parallel write等待事件的时间分布图(后面有介绍)来辅助诊断。
cpu资源的诊断、调优:如果log file sync的时间与log file parallel write的时间差异过大,则可能系统的CPU资源出现了不足。solaris下还可以通过操作系统工具prstat来诊断lgwr进程的延迟时间,见下图的LAT列。其他平台不能直接针对进程进行跟踪诊断,可以通过系统LOAD,CPU使用率来辅助诊断,如CPU使用率超过百分之六十可能就会造成一定程度的调度延迟、CPU运行队列超过物理CPU的CORE数就有调度延迟的风险等等。如果系统的CPU资源出现瓶颈是比较棘手的,因为换硬盘尚且还算是执行起来不算费劲的,但是换CPU难度一般会比较大,最终可能的结果就是换主机。不过也有一些手段可以尝试:调高LGWR的优先级,可以通过数据库参数_high_priority_processes进行,或者操作系统命令renice命令进行(前者可能更好点)。调整LGWR优先级的目的是为了让LGWR尽可能的容易获得CPU资源,减少排队调度时间。
调优应用:不过有时候更为有效的手段可能不是拼命的调优数据库、调优硬件,比如:是不是可以合并事物,也就降低了LOG FILE SYNC的次数,变相的提高了系统事务的效率。
数据库调优:通过设置ORACLE的REDO LOG 块大小为4K来提升日志写的性能.11GR2的版本可以指定REDO LOG的块大小。在我的版本11.2.0.3下修改会报错,说修改值与实际扇区大小不匹配。通过修改隐含参数_disk_sector_size_override为true,可以强制改成功。修改的办法是在alter database add log file xxxx blocksize 4096。如果拿PL/SQL压测,采取commit write immediate wait方式提交,优化前后的差距接近4倍,非常惊人。但是拿我们的业务压测,只是提升了1500+的TPS,也非常的不错了。
内存调优:在AIX下,如果开启内存预读,对于提升TPS也是非常的明显 dscrctl -n -b -s 1 。见http://space.itpub.net/22034023/viewspace-751590。

/*****************************************************************************可怜的LGWR****************************************************************************/
如果有大量进程在等待LOG FILE SYCN,一旦LGWR写完成,它将POST这些进程苏醒,使它们重新进入CPU运行队列,而LGWR会被当初post它写日志的进程push off出cpu运行队列。这个情形下,由于LGWR已经工作了一段时间了(刚刚写完日志),而前台进程已经等待了一段时间了(等待LOG FILE SYNC),根据操作系统的默认的调度策略,这种情况下,前台进程将会有更高的优先级获取CPU资源,而LGWR将可能由于CPU资源突发式的紧张而没有获取到CPU资源,导致系统 的事务数有很大的降低:因为LGWR已经不工作了(虽然时间很短)。因此我前面所建议的调高LGWR进程优先级的手段是值得尝试的。
/*****************************************************************************可怜的LGWR****************************************************************************/
获取log file sync、log file parallel write时间分布
如果我们仅仅观察AWR报告,获取log file sync、log file parallel write某一段时间的平均等待时间,有时候是不够的,我们可能想更精细化的知道,10000次等待里,有多少次等待是在1ms以内,有多少次是在2ms以内,等等。查询V$EVENT_HISTOGRAM可以告诉我们这些信息,对于我们诊断性能问题非常有帮助。
SQL> select event, wait_time_milli,wait_count
2 from v$event_histogram
3 where event = 'log file parallel write';
EVENT WAIT_TIME_MILLI WAIT_COUNT
------------------------- --------------- ----------
log file parallel write 1 22677
log file parallel write 2 424
log file parallel write 4 141
log file parallel write 8 340
log file parallel write 16 1401
log file parallel write 32 812
log file parallel write 64 391
log file parallel write 128 21
log file parallel write 256 6
如上,我们可以知道log file parallel write等待时间在1ms以内的有22677次,2ms以内的有424次,等等。
我们可以简单的取两次V$EVENT_HISTOGRAM的快照,来判断间隔时间内,指标的变化次数来辅助我们诊断问题。(AWR思想)
LOG BUFFER 需要调优?
一般情况下,是不需要调优的!
10G以后,LOG BUFFER一般情况下已经比较大,一般为1到多个granules大小,除非你看到了比较多的log buffer space等待事件,否则不需要调整log buffer的大小。
9.2以后, LOG BUFFER根据你系统CPU的多少,已经被拆分成多个LOG BUFFER,很大程度上缓解了redo allocatoin latch的争用,除非看到了明显的redo allocation latch的争用,否则不用调整log buffer的数量。
10G以后,私有redo和imu的出现,进一步降低了redo allocation latch的争用。每一个私有redo都由一个私有的redo allocation latch保护。同上,一般情况不用调整。
redo相关latch需要调优?
redo copy latch:仅仅用来跟踪是否有进程正在往log buffer里拷贝数据。lgwr在真正开始写之前,必须等待相关的进程拷贝完毕,在此期间,lgwr会等待LGWR wait for redo copy等待。可以同时向log buffer里进行拷贝的进程的数量由_log_simultaneous_copies决定。
redo allocation latch:保护进程在redo buffer里分配空间用的,保证各个进程间彼此分配的空间不重叠。
redo writing latch:这个latch其实保护的是一个标志位,进程获取这个latch后,修改标志位,比如把0改为1,代表lgwr正在写,这样后续的提交进程,获得这个latch后读取标志位,就知道当前LGWR是不是正在写了,避免了很多不需要的重复通知。
我们知道了这几个latch的作用,那么我们需要调优他们吗?
一般是不需要的,除非他们相关的等待已经引起了你的注意,而且ORACLE各个版本也一直在优化相关的latch的获取和释放,比如redo allocation latch,这一块已经做的非常高效了。关于redo allocation latch发展史,查看我的另一篇文章:http://www.itpub.net/thread-1803010-1-1.html
新的调优手段
10GR1的时候,ORACLE公司默默的推出了一个参数:commit_logging,这个参数可以有四种组合:
commit write [batch|immediate][wait|nowait]
10GR2版本发布的时候,这个参数被拆成了2个参数,commit_logging,commit_write,个人认为10GR2拆分后的参数,更能准确表达参数的意图。
我们先着重的看下commit_write这个参数,它的参数值可以为wait/nowait,代表:前台进程事务提交的时候,通不通知LGWR去刷新日志。wait为通知,前台进程会等待log file sync。nowait为不通知,仅仅等待其他操作触发lgwr去写日志(如3秒,1M大小,1/3满)。如果你的业务对数据的一致性的要求不高,对ACID的D没有要求,为了提高事物数、提高性能,你可以选择commit_write为nowait方式。而在10G以前,ACID的D是必须满足的,也就是说,前台进程在提交的时候,是必须要等待LOG FILE SYNC,等待LGWR刷新日志到磁盘的。
我们来简单的看下commit_logging参数,参数可以选择的值有batch/immediate,这个参数极其容易引起人的误解,让人误以为batch的含义是,控制着事物以group commit的方式打包提交。immediate方式是代表让事物一个个的提交,一次提交刷新一次log buffer,但是不是这样的!
immediate与batch相比,commit的改变向量(修改回滚段头的事务槽)将作为单独的redo record产生,跟9I的commit记录日志的方式是一样的。batch 模式下commit日志的记录方式是合并进事务的redo record里,这个batch模式依赖使用私有redo和imu,如果他们关闭的情况下,batch的设置也就没了作用。
我们对insert into a values(1111);commit;来进行dump log file,阐述一下batch/immediate方式的区别 :
DUMP LOG FILE:启用私有redo和imu,设置commit_logging为immediate,commit的日志作为单独的redo record产生,一共2条redo record,第二个redo record为commit产生的,见红色部分(OP:5.4,代表为UNDO段头的修改)
REDO RECORD - Thread:1 RBA: 0x00044d.00000002.0010 LEN: 0x0230 VLD: 0x05
SCN: 0x0000.041b921c SUBSCN: 1 06/25/2013 11:27:32
(LWN RBA: 0x00044d.00000002.0010 LEN: 0002 NST: 0001 SCN: 0x0000.041b921c)
CHANGE #1 TYP:0 CLS:51 AFN:3 DBA:0x00c04c80 OBJ:4294967295 SCN:0x0000.041b91d1 SEQ:1 OP:5.2 ENC:0 RBL:0
ktudh redo: slt: 0x0016 sqn: 0x00002bee flg: 0x0012 siz: 136 fbi: 0
uba: 0x00d1a78d.0068.2c pxid: 0x0000.000.00000000
CHANGE #2 TYP:2 CLS:1 AFN:9 DBA:0x024002c5 OBJ:15750 SCN:0x0000.041b916a SEQ:1 OP:11.2 ENC:0 RBL:0
省略
REDO RECORD - Thread:1 RBA: 0x00044d.00000004.0010 LEN: 0x00d0 VLD: 0x05
SCN: 0x0000.041b921e SUBSCN: 1 06/25/2013 11:27:34
(LWN RBA: 0x00044d.00000004.0010 LEN: 0001 NST: 0001 SCN: 0x0000.041b921d)
CHANGE #1 TYP:0 CLS:51 AFN:3 DBA:0x00c04c80 OBJ:4294967295 SCN:0x0000.041b921c SEQ:1 OP:5.4 ENC:0 RBL:0
ktucm redo: slt: 0x0016 sqn: 0x00002bee srt: 0 sta: 9 flg: 0x2 ktucf redo: uba: 0x00d1a78d.0068.2c ext: 104 spc: 2050 fbi: 0
DUMP LOG FILE:启用私有redo和imu,设置commit_logging为batch,commit作为一个改变向量合并进了事物的redo record里,作为一条redo record,change #3为commit产生的。
REDO RECORD - Thread:1 RBA: 0x00044d.00000002.0010 LEN: 0x0230 VLD: 0x05
SCN: 0x0000.041b921c SUBSCN: 1 06/25/2013 11:27:32
(LWN RBA: 0x00044d.00000002.0010 LEN: 0002 NST: 0001 SCN: 0x0000.041b921c)
CHANGE #1 TYP:0 CLS:51 AFN:3 DBA:0x00c04c80 OBJ:4294967295 SCN:0x0000.041b91d1 SEQ:1 OP:5.2 ENC:0 RBL:0
ktudh redo: slt: 0x0016 sqn: 0x00002bee flg: 0x0012 siz: 136 fbi: 0
uba: 0x00d1a78d.0068.2c pxid: 0x0000.000.00000000
CHANGE #2 TYP:2 CLS:1 AFN:9 DBA:0x024002c5 OBJ:15750 SCN:0x0000.041b916a SEQ:1 OP:11.2 ENC:0 RBL:0
CHANGE #3 TYP:0 CLS:51 AFN:3 DBA:0x00c04c80 OBJ:4294967295 SCN:0x0000.041b921c SEQ:1 OP:5.4 ENC:0 RBL:0
ktucm redo: slt: 0x0016 sqn: 0x00002bee srt: 0 sta: 9 flg: 0x2 ktucf redo: uba: 0x00d1a78d.0068.2c ext: 104 spc: 2050 fbi: 0
个人感觉commit_logging参数的作用不大,可能有助于减少ACID的异常时间,对日志量的size在batch模式下有轻微的减少。ACID异常见我的另一个文章:http://www.itpub.net/thread-1803010-1-1.html
PL/SQL commit优化
传统情况下,当用户发出commit后,用户会话会等待log file sync直到lgwr写完成。LGWR写完成后,通知处于前台进程继续处理后面的操作。这个机制保障了事务的持久性,满足了事务ACID的D。但是PL/SQL不是这么工作的:PL/SQL里的commit 操作不会等待lgwr写完成就可以继续处理后面的操作。简单的看个例子:
begin
for r in (select id from t1 where mod(id, 20) = 0) loop
update t1 set small_no = small_no + .1 where id = r.id;
commit;
end loop;
end;
/
查看session 和 sys相关的统计信息如下:
user commits (session statistic) 25
messages sent (session statistic) 6
redo synch writes(session statistic) 1
log file sync (session events) 1
messages received (lgwr statistic) 6
redo writes (lgwr statistic) 6
log file parallel write (lgwr events) 6
Lgwr仅仅写了6次(log file parallel write),用户会话仅仅等待了log file sync一次。那意味着会话发出commit命令后,并没有停下来等待lgwr写完成,就继续处理后面的事务了。用户会话没有遵守事务的持久化原则!!如果实例在PL/SQL处理的过程中crash,那么某些提交的事务是不可恢复的。Oracle对此有一个貌似合理的解释,在PL/SQL没有处理完毕之前,你不知道已经提交了多少次,Oracle不会使他们可恢复,只有在PL/SQL结束的时候,增加redo sync writes次数和前台进程进入log file sync等待。在进行PL/SQL处理期间,不停的查看等待事件,后台看不到任何的log file sync等待。还有就是统计资料里显示了会话总共向lgwr发送了6次message sent请求(请求写日志),lgwr也接受到了6次message recived信息,并且写了6次(log file parallel write)。你可能会问,到底多久,会话发送一次写请求?每次前台进程给LGWR发送写请求前,会去持有redo writing latch,然后检查lgwr是不是已经在处理写请求了,如果lgwr已经在写了,前台进程不会向LGWR发送请求,也不会等待log fil sync,直接继续完成后续的操作,如果lgwr没在写,前台进程通知lgwr去写,但是不会等待log file sycn,还是继续完成后续的操作,只有在PL/SQL结束的时候,才会最终等待一次log file sync。因此如果你的磁盘写的速率足够快,那么lgwr就会被post的次数越多,成正比的关系。还有如果你的cpu足够强,那么PL/SQL块loop的时间就足够小,时间小了,那么lgwr被post的次数也就少了,成反比的关系(在磁盘写速率一定的情况下)。
值得注意的是,如果PL/SQL里包含了DBLINK,那么就会使用传统的提交方式,不会产生出这样的“异常”。
最后提醒一句:虽然PL/SQL只有在结束的时候才会等待lgwr写完成,产生log file sync等待,但是不要认为,在PL/SQL运行过程中,实例crash掉,此次PL/SQL处理的所有事务就会丢失,不是这样的,只是丢失部分,pl/sql在运行过程中,会话是一直检查lgwr是不是在工作的,如果没在工作,就发送写请求给lgwr的(message sent),lgwr接收到写请求后,就要写日志,只要是被写进了日志文件的事务就是可恢复的。也就是说,虽然前台没有等待log file sync,但是后台其实一直是在忙着处理你的事务日志的。
发现问题的手段
方式一:从awr里去发现,依据avg wait(ms)去判断系统的log file sync和log file parallel write是否存在问题。
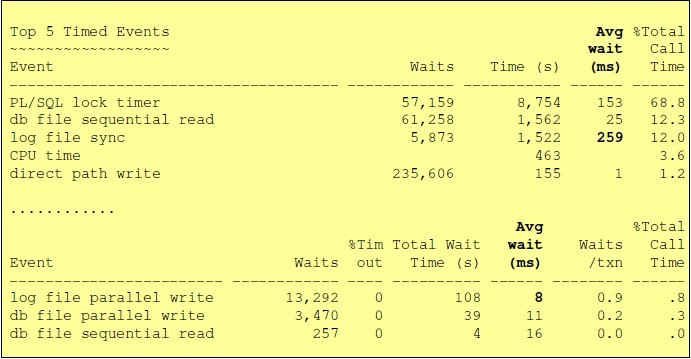
方式二:通过moats工具去诊断当前数据库的top wait有哪些,是否有log file sync、log file parallel write,工具下载地址:http://www.oracle-developer.net/utilities.php。
方式三:通过lewis的snap_events脚本,获得系统级别等待事件的等待次数、平均等待时间。
rem execute snap_events.start_snap
rem execute snap_events.end_snap
方式四:通过tanel poder的snap脚本采样lgwr后台进程的等待事件分布以及lgwr进程相关的统计信息。
- SQL> @snapper out 1 10 1096
- -- Session Snapper v2.01 by Tanel Poder ( http://www.tanelpoder.com )
- ---------------------------------------------------------------------------------
- SID, USERNAME , TYPE, STATISTIC , DELTA, HDELTA/SEC, %TIME, GRAPH
- ---------------------------------------------------------------------------------
- 1096, (LGWR) , STAT, messages sent , 12 , 12,
- 1096, (LGWR) , STAT, messages received , 10 , 10,
- 1096, (LGWR) , STAT, background timeouts , 1 , 1,
- 1096, (LGWR) , STAT, physical write total IO requests , 40, 40,
- 1096, (LGWR) , STAT, physical write total multi block request, 38, 38,
- 1096, (LGWR) , STAT, physical write total bytes, 2884608 , 2.88M,
- 1096, (LGWR) , STAT, calls to kcmgcs , 20 , 20,
- 1096, (LGWR) , STAT, redo wastage , 4548 , 4.55k,
- 1096, (LGWR) , STAT, redo writes , 10 , 10,
- 1096, (LGWR) , STAT, redo blocks written , 2817 , 2.82k,
- 1096, (LGWR) , STAT, redo write time , 25 , 25,
- 1096, (LGWR) , WAIT, LGWR wait on LNS , 1040575 , 1.04s, 104.1%, |@@@@@@@@@@|
- 1096, (LGWR) , WAIT, log file parallel write , 273837 , 273.84ms, 27.4%,|@@@ |
- 1096, (LGWR) , WAIT, events in waitclass Other , 1035172 , 1.04s , 103.5%,|@@@@@@@@@@|
- -- End of snap 1, end=2010-03-23 12:46:04, seconds=1
相关的等待事件
1)log file sync(前台进程的等待事件)
2)log file parallel write(后台进程lgwr的等待事件)
3)log buffer space
lgwr刷新太慢可能会导致这个问题,导致lgwr刷新慢也有几种情况
1.IO子系统太慢
2.lgwr不能获得足够的cpu资源
3.遭遇了大事务(expdp,insert /*+ append */ as ,imp,create as )
也可能是log buffer设置的太小了,不过在现在已经不太可能。默认的尺寸已经很大了。
4)log file single write
这个等待产生的原因是对日志文件头块的读写。一般在如下情况下会产生:
1)日志切换
2)归档
log file sync与buffer busy waits
事物在进行提交的时候,对事物修改的,还在内存里的块做commit cleanout,其实主要就是设置ITL槽位里的commit scn,不会去清楚lb信息。ORACLE在进行commit cleanout期间,会获取相关buffer的buffer pin,而且是排他模式获取,这个pin直到lgwr把日志刷入到磁盘才释放,如果在此期间,有进程对相关的buffer进行select/update/insert就会造成buffer busy waits。因此如果你的系统log file sync指标很高,也可能会导致一定程度的buffer busy waits等待事件。
Reducing Contention for the LRU Chain Latch
https://www.toadworld.com/platforms/oracle/w/wiki/1304.reducing-contention-for-the-lru-chain-latch
When a process tries to use the latch, it is said to acquire it. Once a process acquires the latch, no other processes can acquire that latch. Latches are like a race in a way. They do not have a queuing mechanism and thus, getting a latch is a first serve first come proposition. As a result all process have to contend with each other as they attempt to acquire the same latch. Since there is generally only one latch per structure (with some exceptions) this competition for latches can lead to significant contention issues. The good news is that once the latch is acquired, it is generally released quickly. Exceptions to this rule can be the cause of additional performance problems.
Latch requests come in two flavors, willing to wait and no-wait modes. In willing to wait mode, when a latch cannot be acquired, the acquiring session will go into a spin mode, attempting to acquire the latch over and over a specified number of times. After the number of spins has reached a specific threshold, the session will sleep for a specified period of time, wake up and try the latch again. Spin mode is bad, sleep mode is worse!
A latch request may also be in no wait mode. This is a latching mode that if the request for the latch is not successful then the latch request will simply fail. The process is then free to simply try to reacquire the latch again, or perhaps try to acquire another latch.
This topic addresses the LRU chain latch. The purpose of the LRU chain latch is to protect the LRU chain, which is a list of buffers maintained to support the relative 'hotness' or 'coldness' of buffers and the associated aging mechanism that will age cold buffers out of the cache. Problems with this latch can cause unfortunate response problems with your database.
The LRU latch controls access two LRU lists. The first list, the LRUW, tracks "dirty" (modified blocks not yet written to disk) block buffers. The second list, the LRU, tracks "clean" (unmodified) block buffers. Both lists track the least recently used blocks. When a block is used or freed, it goes to the top of the list, and the blocks below are moved down the list. After the dirty blocks on the LRUW reach a certain level, they are written to disk and placed on the LRU list containing clean blocks. When a clean block is needed, the LRU list is searched. When a clean block is modified, it is placed on the LRUW list for writing by the DB writer.
Waits on latch free wait event ‘Cache Buffers LRU Chain’ may be caused by one of the following:
Reducing Contention for the LRU Chain Latch
Reducing contention for the LRU chain latch
This topic is about how to reduce contention on the cache buffer chains latch. If you are reading this topic, you may be seeing high wait times on this particular latch. In this topic we will briefly discuss what latches are. We will then talk about what the cache buffer chains latch is, and how to determine if it’s a problem. Finally we will discuss some possible resolutions to the problem.About Latching
Internally, Oracle uses various types of structures to control access to elements of the databases including latches and various types of enqueueing (locking) mechanisms. Latches are an elemental locking mechanism that are the primary means used to control access to Oracle internal structures, such as internal memory structures in the SGA. The database buffer cache is a memory area in the Shared Global Area (SGA) where Oracle keeps copies of database blocks. Latching issues can be one major source of performance problems within an Oracle database.When a process tries to use the latch, it is said to acquire it. Once a process acquires the latch, no other processes can acquire that latch. Latches are like a race in a way. They do not have a queuing mechanism and thus, getting a latch is a first serve first come proposition. As a result all process have to contend with each other as they attempt to acquire the same latch. Since there is generally only one latch per structure (with some exceptions) this competition for latches can lead to significant contention issues. The good news is that once the latch is acquired, it is generally released quickly. Exceptions to this rule can be the cause of additional performance problems.
Latch requests come in two flavors, willing to wait and no-wait modes. In willing to wait mode, when a latch cannot be acquired, the acquiring session will go into a spin mode, attempting to acquire the latch over and over a specified number of times. After the number of spins has reached a specific threshold, the session will sleep for a specified period of time, wake up and try the latch again. Spin mode is bad, sleep mode is worse!
A latch request may also be in no wait mode. This is a latching mode that if the request for the latch is not successful then the latch request will simply fail. The process is then free to simply try to reacquire the latch again, or perhaps try to acquire another latch.
Buffer Cache and Latching
The database buffer cache is a memory area in the Shared Global Area (SGA) where Oracle keeps copies of database blocks. Two latches are used to principally control access to structures within the SGA, the cache buffer LRU chains latch and the cache buffer chains latch.This topic addresses the LRU chain latch. The purpose of the LRU chain latch is to protect the LRU chain, which is a list of buffers maintained to support the relative 'hotness' or 'coldness' of buffers and the associated aging mechanism that will age cold buffers out of the cache. Problems with this latch can cause unfortunate response problems with your database.
The LRU latch controls access two LRU lists. The first list, the LRUW, tracks "dirty" (modified blocks not yet written to disk) block buffers. The second list, the LRU, tracks "clean" (unmodified) block buffers. Both lists track the least recently used blocks. When a block is used or freed, it goes to the top of the list, and the blocks below are moved down the list. After the dirty blocks on the LRUW reach a certain level, they are written to disk and placed on the LRU list containing clean blocks. When a clean block is needed, the LRU list is searched. When a clean block is modified, it is placed on the LRUW list for writing by the DB writer.
Cache Buffers LRU Chain Latch Causes
The cache buffers LRU chain latch is held when updates are made to the LRU (Least Recently Used) lists. Cache buffers LRU chain latch contention is caused when the LRU and LRUW lists are updated and the chains of buffers in each hash bucket are too numerous to be scanned quickly. Contention is also caused when the volume of transactions overloads the block tracking on the LRU lists.Waits on latch free wait event ‘Cache Buffers LRU Chain’ may be caused by one of the following:
- SQL
statements with very high logical or physical I/O, due to unselective
indexes (large index range scans) or many full table scans.
- DBWR
not keeping up with the dirty workload, which forces the foreground
process to hold the latch longer looking for a free buffer.
- Undersized buffer cache.
Solutions
-
High logical IO rates
Because latches are used to protect the
buffer cache, very high rates of logical IO - possibly due to untuned
SQL - will increase the rate and duration of latch holds and increase
the probability that latch contention will occur. The solution to this
problem is tuning your SQL to reduce overall LIO’s.
To solve this problem, first identify SQL statements that are performing a high amount of I/O and tune them to reduce the number of buffer gets and disk reads.
To determine SQL statements with the most disk reads per execution:
column per_exec format 999,999,999
column disk_reads format 999,999,999

select disk_reads, executions, disk_reads/executions per_exec,
       substr(sql_text,1,4000) SQL
  from v$sqlarea
 where executions > 1
   and disk_reads/executions > 10000
order by disk_reads/executions desc
/
To determine SQL statements with the most buffer gets per execution:
column per_exec format 999,999,999
column buffer_gets format 999,999,999

select buffer_gets, executions, buffer_gets/executions per_exec,
       substr(sql_text,1,4000) SQL
  from v$sqlarea
 where executions > 1
   and buffer_gets/executions > 10000
order by buffer_gets/executions desc
/
Another potential solution is to increase the parameter db_block_lru_latches setting in Oracle versions earlier than 9i (this parameter is a hidden parameter in Oracle9i, _db_block_lru_latches). We suggest setting this parameter to a value of 2 times the number of CPU’s in your system.
-
Determine if the Database
Writer (DBWR) background process is not keeping up with writes of
dirty buffers back to disk.
Check
and see if there are sessions waiting on a ‘free buffer’ wait event.
column event format a30
column username format a20
column state format a10 trunc
column p1 format 999999999999 heading "P1"
column p2 format 999999999999 heading "P2"
column p3 format 99999 heading "P3"
set lin 132

SELECT username, V$SESSION_WAIT.sid, event, seq#,
       seconds_in_wait, wait_time, p1 , p2, p3,
       state, p1raw, p2raw, p3raw
  FROM V$SESSION_WAIT, V$SESSION
WHERE V$SESSION_WAIT.SID = V$SESSION.SID
AND event = ‘free buffer’
/
These waits could indicate that there is unselective SQL flooding the buffer cache or that the DBWR is not writing buffers to disk fast enough. A good way to tell if the DBWR process is not keeping up is to compare checkpoints started and completed.
select *
from v$sysstat
where name like 'background checkpoint%'
/
When a checkpoint occurs, the Log Writer (LGWR) process will instruct the DBWR to write buffers to disk. If checkpoints started and completed are not the same, then a checkpoint has occurred before the last one has completed. The way to remedy this is to increase the size of the redo logs and make sure that checkpoints only occur at a log switch.
To find the size of the redo log files and how frequently the log switch is occurring:
col bytes format 999,999,999

select a.group#, b.member, a.bytes, a.first_time
  from v$log a, v$logfile b
 where a.group# = b.group#
/
The solution to this problem is to either reduce the load on the DBWR process, or increase the number of DBWR processes (typically if you are not running Asynchronous IO). You can configure multiple DBWR processes via the db_writer_processes parameter. This parameter allows you to configure up to 10 database writer processes. Generally when using AIO, you will not see any benefits when using multiple DBWR processes.
Another solution is to look at the overall placement of files on the disks and review the IO distribution, to ensure that the datafiles being written to are receiving an optimal distribution of all disk IO’s. Also, you should ensure your disks are running optimally, as is the rest of the system. We have also seen asynchronous IO (AIO) configurations cause significant problems with DBWR performance.
- The buffer cache is undersized.
A
good buffer cache hit ratio does not necessarily mean that the buffer
cache is sized correctly. As a matter of fact, poorly tuned SQL can
inflate this as a large number of the same buffers are accessed more then
once. However, a poor hit ratio with tuned SQL in the application can be an
indicator that the buffer cache is too small.
To check the buffer cache hit ratio:
col "Buffer Cache Hit Ratio" format a23

select to_char((sum(decode(name, 'consistent gets',value, 0)) +
       sum(decode(name, 'db block gets',value, 0)) –
       sum(decode(name, 'physical reads',value, 0)) –
       sum(decode(name, 'physical reads direct',value, 0))) /
       (sum(decode(name, 'consistent gets',value, 0)) +
       sum(decode(name, 'db block gets',value, 0))) *
       100,'999.99') || ' %' "Buffer Cache Hit Ratio"
from v$sysstat st
/
If it appears that the buffer cache will benefit from being made larger, then certainly consider increasing the size of the database buffer cache. Indications that the buffer cache is stressed, and perhaps needing resized, are high wait values for these events:
- Free buffer waits
- Buffer deadlock
- Buffer busy waits
- Summed dirty queue length
- DBWR make free requests
- DBWR summed scan depth
- DBWR buffers scanned
- Free buffer requested
- Dirty buffers inspected
- Pinned buffers inspected
cache buffers lru chain
http://www.jydba.net/cache-buffers-lru-chain/
cache buffers lru chain闩锁竞争与解决
当用户进程需要读数据到buffer cache时,或cache buffer根据lru算法进行管理时,就不可避免地要扫描
lru list获取可用buffer或更改buffer的状态,我们知道,oracle的buffer cache是共享内存,可以为众多
并发进程并发访问,所以在搜索的过程中必须获取latch(latch是oracle的一种串行锁机制,用于保护共享内存结构)
,锁定内存结构,防止并发访问损坏内存中的数据.
这个用于锁定lru的latch就是经常见到的cache buffers lru chain.
1.适当的增大buffer cache,这样可以减少读数据到buffer cache的机会,减少扫描lru list的竞争
2.可以适当增加lru latch的数量,修改_db_block_lru_latches参数可以实现,但是该参数通常来说
是足够的,除非在oracle support的建议下或确知是该参数带来的影响,否则不推荐修改
3.通过多缓冲池技术,可以减少不希望的数据老化和全表扫描等操作对于default池的冲击,
从而可以减少竞争
当用户进程需要读数据到buffer cache时,或cache buffer根据lru算法进行管理时,就不可避免地要扫描
lru list获取可用buffer或更改buffer的状态,我们知道,oracle的buffer cache是共享内存,可以为众多
并发进程并发访问,所以在搜索的过程中必须获取latch(latch是oracle的一种串行锁机制,用于保护共享内存结构)
,锁定内存结构,防止并发访问损坏内存中的数据.
这个用于锁定lru的latch就是经常见到的cache buffers lru chain.
SQL> select addr,latch#,name,gets,misses,immediate_gets,immediate_misses
  2  from v$latch where name='cache buffers lru chain';

ADDR                 LATCH# NAME                          GETS     MISSES       IMMEDIATE_GETS IMMEDIATE_MISSES
---------------- ---------- ----------------------------- ---------- ---------- -------------- ----------------
C00000000BE23B10        117 cache buffers lru chain        2601887       8060      106765296           597096
cache buffers lru chain latch存在多个子latch,它的数量受隐含参数_db_block_lru_latches控制
SQL> select x.ksppinm name,y.ksppstvl value,x.ksppdesc describ
  2  from sys.x$ksppi x,sys.x$ksppcv y
  3  where x.inst_id=USERENV('Instance')
  4  and y.inst_id=USERENV('Instance')
  5  and x.indx=y.indx
  6  and x.ksppinm like '%_db_block_lru_latches%';

NAME                         VALUE          DESCRIB
---------------------------- -------------  -------------------------------
_db_block_lru_latches        32             number of lru latches
可以从v$latch_children视图查看当前各子latch使用的情况:
SQL> select addr,latch#,name,gets,misses,immediate_gets,immediate_misses
  2  from v$latch_children where name='cache buffers lru chain';

ADDR                 LATCH# NAME                                GETS     MISSES IMMEDIATE_GETS IMMEDIATE_MISSES
---------------- ---------- -------------------------  -------------- ---------- -------------- ----------------
C00000047AB14E80        117 cache buffers lru chain                68          0              0                0
C00000047AB14928        117 cache buffers lru chain                68          0              0                0
C00000047AB143D0        117 cache buffers lru chain                68          0              0                0
C00000047AB13E78        117 cache buffers lru chain                68          0              0                0
C00000047AB13920        117 cache buffers lru chain                68          0              0                0
C00000047AB133C8        117 cache buffers lru chain                68          0              0                0
C00000047AB12E70        117 cache buffers lru chain                68          0              0                0
C00000047AB12918        117 cache buffers lru chain                68          0              0                0
C00000047AB123C0        117 cache buffers lru chain                68          0              0                0
C00000047AB11E68        117 cache buffers lru chain                68          0              0                0
C00000047AB11910        117 cache buffers lru chain                68          0              0                0
C00000047AB113B8        117 cache buffers lru chain                68          0              0                0
C00000047AB10E60        117 cache buffers lru chain                68          0              0                0
C00000047AB10908        117 cache buffers lru chain                68          0              0                0
C00000047AB103B0        117 cache buffers lru chain                68          0              0                0
C00000047AB0FE58        117 cache buffers lru chain                68          0              0                0
C00000047AB0F900        117 cache buffers lru chain                68          0              0                0
C00000047AB0F3A8        117 cache buffers lru chain                68          0              0                0
C00000047AB0EE50        117 cache buffers lru chain                68          0              0                0
C00000047AB0E8F8        117 cache buffers lru chain                68          0              0                0

ADDR                 LATCH# NAME                                 GETS     MISSES IMMEDIATE_GETS IMMEDIATE_MISSES
---------------- ---------- -------------------------  -------------- ---------- -------------- ----------------
C00000047AB0E3A0        117 cache buffers lru chain            658582       2096       27333396           148252
C00000047AB0DE48        117 cache buffers lru chain            659346       2092       27372470           148770
C00000047AB0D8F0        117 cache buffers lru chain            660582       2168       27373352           148620
C00000047AB0D398        117 cache buffers lru chain            657057       1824       27227832           152743
C00000047AB0CE40        117 cache buffers lru chain                68          0              0                0
C00000047AB0C8E8        117 cache buffers lru chain                68          0              0                0
C00000047AB0C390        117 cache buffers lru chain                68          0              0                0
C00000047AB0BE38        117 cache buffers lru chain                68          0              0                0
C00000047AB0B8E0        117 cache buffers lru chain                70          0              2                0
C00000047AB0B388        117 cache buffers lru chain                70          0              3                0
C00000047AB0AE30        117 cache buffers lru chain                70          0              3                0
C00000047AB0A8D8        117 cache buffers lru chain                70          0              2                0

32 rows selected
如果该latch竞争激烈,通常有如下方法可以采用.
1.适当的增大buffer cache,这样可以减少读数据到buffer cache的机会,减少扫描lru list的竞争
2.可以适当增加lru latch的数量,修改_db_block_lru_latches参数可以实现,但是该参数通常来说
是足够的,除非在oracle support的建议下或确知是该参数带来的影响,否则不推荐修改
3.通过多缓冲池技术,可以减少不希望的数据老化和全表扫描等操作对于default池的冲击,
从而可以减少竞争
2017年12月6日 星期三
500 Can't connect to LWP::UserAgent
1. in
cpan, force install IO::Socket::IP
2. my $agent = LWP::UserAgent->new(ssl_opts => { verify_hostname => 0});
2017年11月15日 星期三
使用 ps 與 top 指令列出系統上最吃 CPU 與記憶體的程式
https://blog.gtwang.org/linux/ps-top-find-processes-by-cpu-memory-usage/
ps -eo pid,ppid,cmd,%mem,%cpu --sort=-%mem | head
ps -eo pid,ppid,cmd,%mem,%cpu --sort=-%cpu | head
top -b | head -n 17
以下在我的版本不work
top -b -o +%CPU | head -n 17
top -b -o +%MEM | head -n 17
2017年10月25日 星期三
網頁計算字元數字(bytes)
https://www.puritys.me/docs-blog/article-107-String-Length-%E4%B8%AD%E6%96%87%E5%AD%97%E4%B8%B2%E9%95%B7%E5%BA%A6.html
- tx = "測式中文xxxx";
- var str = encodeURIComponent(tx);
- console.log("utf8:"+str);
- len = str.replace(/%[A-F\d]{2}/g, 'U').length;
- console.log("len = "+len);
訂閱:
文章 (Atom)